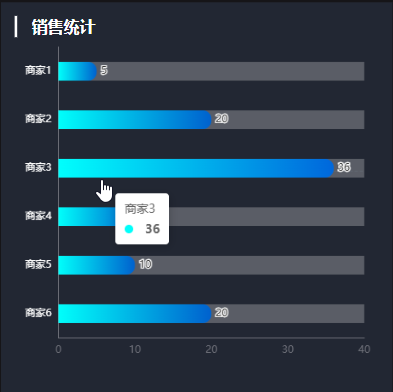


ECharts文档:https://echarts.apache.org/handbook/zh/basics/import
NPM 安装 ECharts
你可以使用如下命令通过 npm 安装 ECharts
npm install echarts --save引入 ECharts
import * as echarts from 'echarts';

// 基于准备好的dom,初始化echarts实例
var myChart = echarts.init(document.getElementById('main'));
// 绘制图表
myChart.setOption({
  title: {
    text: 'ECharts 入门示例'
  },
  tooltip: {},
  xAxis: {
    data: ['衬衫', '羊毛衫', '雪纺衫', '裤子', '高跟鞋', '袜子']
  },
  yAxis: {},
  series: [
    {
      name: '销量',
      type: 'bar',
      data: [5, 20, 36, 10, 10, 20]
    }
  ]
});
Vue3中使用
<template>
  <div class="screen-block">
    <Title>销售统计</Title>
    <div ref="chartRef" style="width: 100%; height: 90%"></div>
  </div>
</template>

<script setup lang="ts">
import { shallowRef, onMounted } from "vue";
import type { ECharts, EChartsCoreOption } from "echarts";
import * as echarts from "echarts";
import Title from "../Title.vue";

// 1.根据DOM初始化echarts实例
const chartRef = shallowRef<HTMLElement | null>(null);
const chart = shallowRef<ECharts | null>(null);

onMounted(() => {
  chart.value = echarts.init(chartRef.value);
  renderChart();
});

// 2.构建option配置对象
const renderChart = () => {
  const option: EChartsCoreOption = {
    // title: {
    //   text: "销售统计",
    //   textStyle: {
    //     color: "#fff",
    //   }
    // },
    tooltip: {
      trigger: "axis",
      axisPointer: {
        type: "line",
        z: 0,
        lineStyle: {
          color: "#2d3443",
        },
      },
    },
    // legend: {
    //   data: [
    //     {
    //       name: "销售额",
    //       icon: "circle",
    //       textStyle: {
    //         color: "#fff",
    //       },
    //     },
    //   ],
    // },
    //x轴
    xAxis: {
      splitLine: { show: false }, // 是否显示网格线
      axisLine: { show: true }, // 是否显示轴线
      type: "value", // 作为数据展示
      // max: function (value: any) {
      //   return parseInt(value.max * 1.2 + "");
      // },
    },
    //y轴
    yAxis: {
      type: "category",
      data: ["商家1", "商家2", "商家3", "商家4", "商家5", "商家6"],
      inverse: true, // y轴反向
      axisLine: { show: true }, // 是否显示轴线
      axisTick: { show: false }, // 是否显示刻度
      axisLabel: {
        color: "#fff",
      },
    },
    grid: {
      top: "3%",
      right: "4%",
      bottom: "3%",
      left: "3%",
      containLabel: true,
    },
    series: [
      {
        type: "bar",
        label: {
          show: true,
          position: "right",
        },
        data: [5, 20, 36, 10, 10, 20],
        barWidth: 22,
        roundCap: true,
        showBackground: true,
        backgroundStyle: {
          color: "rgba(220, 220, 220, 0.3)",
        },
        itemStyle: {
          borderWidth: 0,
          borderRadius: [0, 10, 10, 0],
          color: new echarts.graphic.LinearGradient(0, 0, 1, 0, [
            {
              offset: 0,
              color: "#00fffb",
            },
            {
              offset: 1,
              color: "#0061ce",
            },
          ]),
        }
      }
      // {
      //   type: "bar",
      //   name: "销售额",
      //   data: [5, 20, 36, 10, 10, 20],
      //   showBackground: true,
      //   backgroundStyle: {
      //     color: "rgba(220, 220, 220, 0.3)",
      //   },
      //   itemStyle: {
      //     color: "#f00", // 柱状图颜色
      //     barBorderRadius: 5, // 柱状图圆角
      //     shadowColor: "rgba(0, 0, 0, 0.5)", // 阴影颜色
      //     shadowBlur: 10, // 模糊度
      //   },
      //   barWidth: 10, // 柱状图宽度
      //   label: {
      //     show: true,
      //     position: "right",
      //     textStyle: {
      //       color: "#fff",
      //     },
      //   },
      // },
    ],
  };

  // 3.echarts实例调用setOption方法,传入option对象
  chart.value!.setOption(option);
};
</script>

<style lang="scss" scoped>
.screen-block {
  width: 100%;
  height: 460px;
  background-color: var(--ds-block-bg);
  padding: 16px;
  margin-top: 20px;
}
</style>